
Every click begins a quiet journey: a request leaves a browser, crosses networks, and lands on hardware you may never see. Server and hosting analysis is the discipline of mapping that journey-translating business goals and technical constraints into measurable choices about where workloads run, how they scale, and what they cost.
This article offers a structured way to evaluate hosting options and server designs without allegiance to any vendor or trend. We will examine the core dimensions that matter-performance, reliability, security, scalability, operability, compliance, sustainability, and total cost of ownership-and show how to measure them with meaningful metrics rather than assumptions. Along the way, we will compare common models: shared hosting, VPS, dedicated and bare metal, public cloud IaaS, managed platforms, containers and Kubernetes, serverless, and edge/CDN overlays.
Expect practical methods: workload profiling and capacity planning; latency budgets and throughput targets; SLA and SLO interpretation; observability baselines and incident data; cost modeling that accounts for egress, licensing, and staff time; and risk analysis across redundancy, vendor lock-in, and data gravity. We will also touch on geography and compliance, energy considerations, and lifecycle decisions from procurement to decommissioning.
By the end, you will have a clear framework-a compass rather than a map-for comparing hosting environments and making defensible, data-informed infrastructure choices.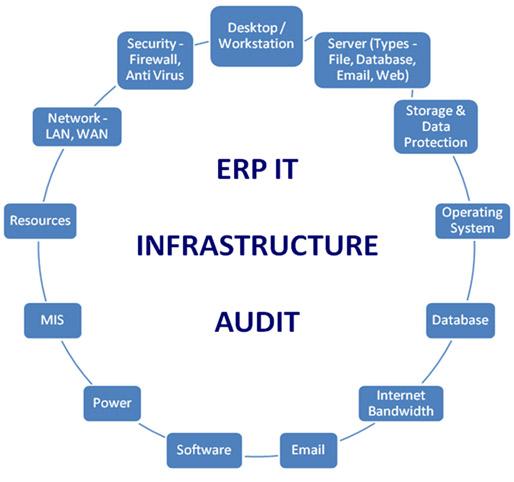
Infrastructure audit from bare metal to cloud hosting with right sizing guidance
See through the entire stack-from racked servers and hypervisors to Kubernetes clusters and managed cloud services-to reveal what runs where, why it costs what it does, and how it performs under real demand. We correlate utilization curves, latency and IOPS profiles, egress patterns, and license footprints against business SLAs to surface stranded capacity, noisy neighbors, and zombie workloads. The result is a factual map that distinguishes critical, steady-state systems from bursty or seasonal loads so each lands on the platform that fits it best.
- Asset & dependency graph: close CMDB gaps, trace upstream/downstream services.
- Performance baselines: CPU/memory/IOPS at p95, queue depth, headroom.
- Resilience posture: RPO/RTO vs. reality, failover tests, single points of failure.
- Security & compliance: patch cadence, CIS drift, key/cert hygiene.
- Cost signals: host density, RI coverage, data transfer hotspots, licensing per core.
- Cloud readiness: containerization fit, stateful constraints, data gravity.
| Layer | Current Signal | Right‑Size Action |
|---|---|---|
| Compute | 18% avg CPU on 64 vCPU | Downsize to 16-24 vCPU; add autoscaling for peaks |
| Storage | 30% read cache hit | Tier cold data to object; enable compression |
| Network | High inter‑AZ egress | Consolidate paths; use PrivateLink/peering |
| Database | License bound, low I/O | Right‑size cores; adopt managed with storage autoscale |
| Platform | Control plane toil | Shift to managed K8s or serverless for spiky jobs |
Guidance translates into a pragmatic rightsizing playbook: classify workloads by volatility and criticality; blend Reserved/Committed, On‑Demand, and Spot; tune autoscaling to p95 not averages; pick AMD/ARM families where supported; schedule shutdowns; optimize per‑core licensing; and enforce tagging for showback. We outline migration paths-rehost quick wins, replatform databases with minimal downtime, and refactor candidates into containers or functions-with canaries, SLO guards, and rollback baked in. Expect clear change windows, cost projections, and KPI dashboards so every move is traceable, reversible, and measurably better.
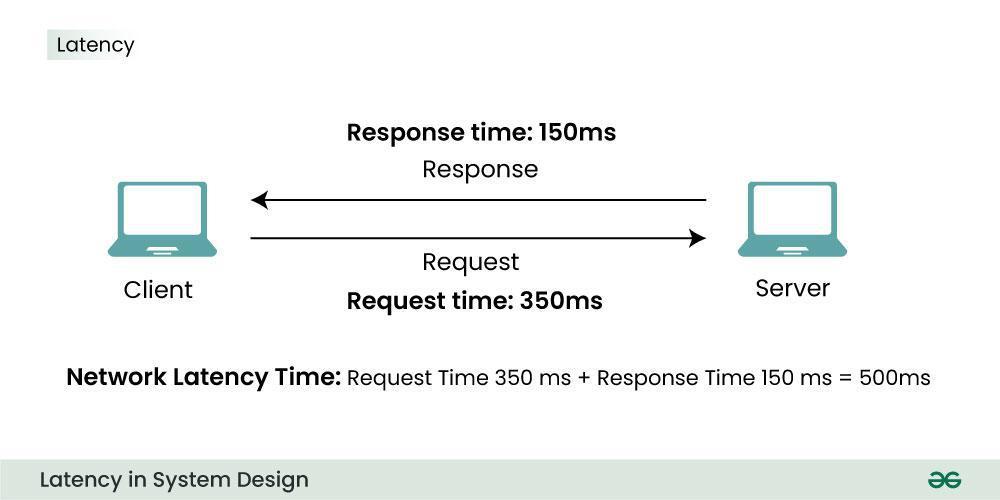
Latency throughput and uptime benchmarks with concrete tuning steps
Latency, throughput, and uptime tell a complete story only when measured across p50/p95/p99 and correlated with load and failure modes. Using synthetic probes, real-user monitoring, and server-side traces, you can pin down cold-start penalties, queue buildup, and cross-zone hiccups. The table below captures a representative baseline on a modest 4 vCPU VM and the lift after targeted tuning; each improvement is tied to the primary mechanism that moved the metric, keeping the path from symptom to fix explicit.
| Metric | Baseline | After Tuning | Method | SLO |
|---|---|---|---|---|
| p50 latency | 180 ms | 92 ms | CDN edge + TLS 1.3 + keep‑alive | ≤ 100 ms |
| p95 latency | 620 ms | 240 ms | DB cache + HTTP/2 + async I/O | ≤ 300 ms |
| p99 latency | 1.8 s | 540 ms | Queue trim + timeouts + autoscale | ≤ 600 ms |
| Throughput (RPS) | 3.2k | 6.1k | SO_REUSEPORT + workers + pooling | ≥ 5k |
| Uptime (30d) | 99.83% | 99.98% | Multi‑AZ + health checks | ≥ 99.95% |
Apply focused adjustments that compress tail latency, raise sustainable RPS, and harden availability under bursty traffic and partial failures. The steps below are pragmatic, reversible, and traceable to the gains above.
- Network/kernel: enable BBR congestion control; raise somaxconn; tune tcp_rmem/wmem; set tcp_fastopen; use SO_REUSEPORT; prefer tcp_nodelay on hot paths.
- TLS/HTTP: enforce TLS 1.3 with session tickets + OCSP stapling; allow 0‑RTT for idempotent GET; enable HTTP/2 and HTTP/3; prioritize critical streams.
- Proxy/web tier: auto-scale worker_processes; increase worker_connections; set keepalive_requests and sane timeouts to cap queues; compress with Brotli for text.
- Caching/CDN: push static assets to edge; use Cache‑Control + stale‑while‑revalidate; normalize cache keys; convert images to WebP/AVIF.
- Application: favor async I/O and connection reuse; batch small calls; prewarm JIT/containers on deploy to avoid cold spikes.
- Database: right‑size connection pools; add read replicas; cache hot rows in Redis; enable prepared statements; fix slow queries found via EXPLAIN.
- Queues/back‑pressure: cap queue length; drop or shed non‑critical work early; use DLQ for retries with jitter and ceilings.
- Resilience: health‑check per hop; implement circuit breakers and hedged requests for tail shaving; deploy with blue‑green or rolling updates.
- Observability & SLOs: track the four golden signals; wire burn‑rate alerts to p95/p99 and error budgets; correlate metrics, logs, and traces for rapid regression detection.
Security posture backup strategy and disaster recovery drills you can implement
Protect first, then preserve: shape backups around your threat model, not just your storage budget. Combine the 3-2-1-1-0 pattern (3 copies, 2 media, 1 offsite, 1 immutable/air‑gapped, 0 unresolved verification errors) with encryption-at-rest, object lock/WORM, MFA‑delete, and separate cloud accounts/tenants for blast-radius isolation. Back up more than data: include database logs/WAL, infrastructure-as-code, container images, secrets managers’ snapshots (never plain secrets), DNS zones, and monitoring/alert rules. Define tiered RPO/RTO, automate schedules, lifecycle policies, and retention with legal hold where required. Verify continuously with checksum validation and routine test restores into a clean, quarantined environment, logging each run into a tamper‑evident audit trail.
| Asset Tier | RPO | RTO | Medium | Verification |
|---|---|---|---|---|
| Critical DB | ≤15m | ≤1h | Encrypted snapshots + WAL | Hourly checksums, weekly full restore |
| App Config & IaC | ≤4h | ≤8h | Git mirror + object lock | Daily dry-run apply |
| Static Assets | ≤24h | ≤4h | CDN + object storage | Weekly integrity audit |
| Secrets Store | Design for rotate | ≤2h | Vault snapshot (sealed) | Quarterly recovery drill |
Practice recovery like a fire drill. Codify runbooks with step‑by‑step, role‑based actions, pre‑approve elevated access for break‑glass use, and rehearse scenarios: ransomware, region loss, misconfig push, certificate expiration, and database corruption. Use game days and chaos experiments to measure real RTO/RPO, prove DNS cutover (short TTLs), cold/warm standby promotion, data integrity on restore, and failback without data drift. Automate restores with pipelines, isolate recovery networks, and include communications, customer notices, and post‑mortem templates so that the technical and human playbooks align.
- Before drills: snapshot current state, pin images, export configs, and stage sanitized test data.
- During drills: time every step, capture logs/metrics, validate access boundaries, and sign off with dual control.
- After drills: rotate keys/secrets, update runbooks, fix toil with automation, and track deltas to target RTO/RPO.
- Cadence: monthly tabletop, quarterly partial failover, annual full-region recovery with executive comms practice.
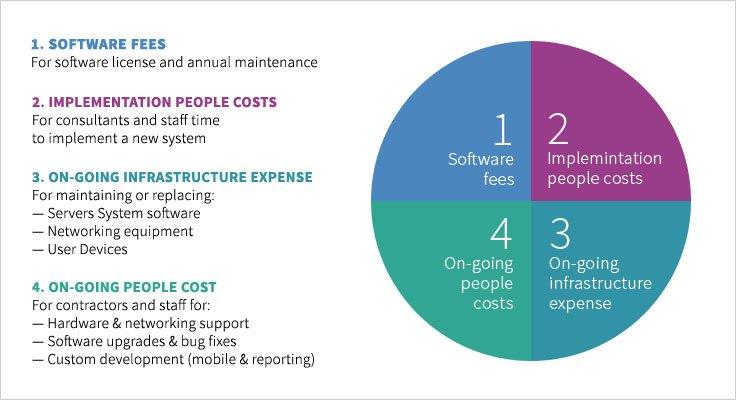
Total cost of ownership licensing and provider negotiations with clear savings scenarios
Map the money trail end‑to‑end across a 36‑month horizon: split CapEx vs. OpEx, normalize per‑core, per‑VM, and socket licensing, then layer in bandwidth tiers, storage IOPS, backup/DR, and support SLAs. Expose hidden bleed such as idle capacity, over‑provisioned CPU, change‑order fees, and data egress. The result is a defensible model that compares like‑for‑like across clouds, bare metal, and colocation while isolating what actually moves the needle-license rights, utilization, and commitments.
- Compute: vCPU/core packs, RI/SP coverage, burst premiums
- Storage: performance tiers, snapshots, cross‑region replication
- Network: egress, inter‑AZ traffic, CDN offload
- Licenses: BYOL vs. bundled, edition mix, consolidation
- Support: 24/7 response, TAM, escalation bands
- Compliance: audit posture, isolation, data residency
- Exit/Migration: tooling, downtime windows, dual‑run overlap
| Scenario | Monthly Cost | 36‑mo TCO | Estimated Savings |
|---|---|---|---|
| Baseline (as‑is) | $28,400 | $1,022,400 | – |
| Optimized license mix | $23,900 | $860,400 | $162,000 (16%) |
| 3‑yr commit + RIs/SPs | $21,600 | $777,600 | $244,800 (24%) |
| Hybrid (steady DB to colo) | $19,800 | $712,800 | $309,600 (30%) |
Translate the model into a negotiation playbook: package workloads to raise provider win‑rate, ask for multi‑year price locks, and push co‑term renewals to simplify governance. Use BYOL where audit‑safe, right‑size instances by measured peak, pool bandwidth, and request migration credits for dual‑run overlap. Target 15-30% total savings by stacking levers-edition downgrades or core consolidation, committed‑use discounts, reserved capacity, and support re‑tiers-then benchmark quarterly to prevent drift and keep the savings real.
The Way Forward
In the end, server and hosting analysis is less a destination than a cadence: assess, test, tune, repeat. From bare metal to managed cloud, from latency budgets to RTO/RPO, the variables are many-but so are the instruments for measuring them. Aligning performance, resilience, security, cost, compliance, and sustainability is not about finding a single “best” platform; it’s about fitting an evolving workload to an evolving architecture.
As you move forward, treat observability, capacity planning, and failure testing as ongoing practice-not project milestones. Define clear SLOs, validate them with real workloads, right-size continuously, and document the trade-offs you’re willing to accept. Contracts, SLAs, data locality, and energy profiles deserve the same scrutiny as throughput charts.
Choose deliberately, measure relentlessly, adapt continuously. The stack will change; your analysis should change with it.